

For our office election watch party last night, we wanted to watch results on as many simultaneous races as we could but we were particularly interested in the locals.
That's because we knew the national races would be covered heavily and we had a projector set up for TV coverage, but the local races would be more difficult to follow without a lot of channel flipping. At the same time, we also knew we weren't going to come up with some sort of hologram-Wolf-Blitzer-projected-on-a-touch-screen-ice-rink level visualization in just a couple of hours. We could build something fun, responsive, and autonomous though.
To get it done quickly I'd need to channel my past in the newspaper industry and remember that doing it "right" wasn't worth much of anything if it wouldn't be done until it was two days too late.
The game plan was as follows:
- Scrape local/state election data from the internet, on an interval
- Load election data into a prebuilt dashboarding tool, on an interval
Identify Sources
I was interested in two sets of races: The Arkansas state referendum, and the major City of Fayetteville races (4 city council alderman races and one mayoral race).
I reached out to a contact at the local newspaper to ask if they'd have live data coming in across the AP wire or elsewhere. It turned out an election results webpage was already live for me to start inspecting. Score. I checked out the local races page and found the markup looked like this:
<div class="elections-race card card-block">
<h4 class="card-title">ALDERMAN </h4>
<h4 class="card-title">WARD 1, POSITION 2 </h4>
<span class="elections-county-reporting"></span>
<div class="elections-candidates clearfix" id="race-9053">
<div class="candidate-tr clearfix candidate">
<div class="col-xs-4 col-lg-3 candidate-td candidate-name">
<span> <span>*</span> Sarah Marsh
</span>
</div>
<div class="col-xs-4 col-lg-2 candidate-td candidate-vote-count">
0
</div>
<div class="col-xs-4 col-lg-1 candidate-td vandidate-vote-percent">
0<span>%</span>
</div>
<div class="col-xs-12 col-lg-6 candidate-td candidate-progress">
<progress class="progress progress-striped progress-success" value="0" max="0">
<div class="progress progress-success">
<span class="progress-bar" style="width: 0%;"></span>
</div>
</progress>
</div>
</div>
<div class="candidate-tr clearfix candidate">
<div class="col-xs-4 col-lg-3 candidate-td candidate-name">
<span> Paul Phaneuf
</span>
</div>
<div class="col-xs-4 col-lg-2 candidate-td candidate-vote-count">
0
</div>
<div class="col-xs-4 col-lg-1 candidate-td vandidate-vote-percent">
0<span>%</span>
</div>
<div class="col-xs-12 col-lg-6 candidate-td candidate-progress">
<progress class="progress progress-striped" value="0" max="0">
<div class="progress">
<span class="progress-bar" style="width: 0%;"></span>
</div>
</progress>
</div>
</div>
<span class="elections-meta-time">
</span>
</div>
</div>
Not bad. Bootstrap definitely gives us a lot of CSS selectors to work with. There's a lot of whitespace around the candidate names, but that can be dealt with. The race title, at least in some cases, is split between two <h4 class="card-title"> tags which will also need to be reconciled.
Not shown in this markup is the way individual counties and cities are labeled in this data, but they were h3 and h4 tags, respectively, that were siblings to these <div class="elections-race"> divs. That would be harder to sort out--we'd have to walk back through the nearest preceding sibling elements to find the relevant municipality.
I then turned my attention to the state ballot issues page and found a lot of this:
<script language="JavaScript" src="http://hosted.ap.org/elections/2016/general/by_race/AR_6486.js?SITE=ARLIDELN&SECTION=POLITICS"></script>
After having a newspaper flashback (these hosted Associated Press scripts are full of document.write()) I decided I didn't want to deal with parsing or rendering javascript, so I looked elsewhere for the state data which should be easier to find--and it was.
Politico had the state referendums, and they looked like this:
<div class="results-detail" data-racenum="6485" data-stateabb="AR">
<div class="macro">
<div class="results-about">
<h6>Amend Term Limits and Rules</h6>
<p class="summary">Concerns term limits for members of the Arkansas General Assembly. </p>
<p class="reporting">0% Reporting</p>
<p class="share"><a href="https://twitter.com/intent/tweet?text=%23AR amend term limits and rules ballot measure passes%3B 0%25 reporting.&url=http://politi.co/2epgNZ5&hashtags=election2016" class="twitter" target="_blank"><b aria-hidden="true" class="icon icon-twitter"></b></a></p>
</div>
</div>
<div class="micro">
<table class="results-table">
<tbody>
<tr class="type-ballot">
<th scope="row" class="results-name"><span class="name-combo"><span class="token token-winner"><b aria-hidden="true" class="icon icon-check"></b><span class="icon-text">Winner</span></span> For</span></th>
<td class="results-percentage"><span class="percentage-combo"><span class="number">0%</span><span class="graph"><span class="bar"><span class="index" style="width:0%;"></span></span></span></span></td>
<td class="results-popular">0</td>
</tr>
<tr class="type-ballot">
<th scope="row" class="results-name"><span class="name-combo"> Against</span></th>
<td class="results-percentage"><span class="percentage-combo"><span class="number">0%</span><span class="graph"><span class="bar"><span class="index" style="width:0;"></span></span></span></span></td>
<td class="results-popular">0</td>
</tr>
</tbody>
</table>
</div>
</div>
This markup was a bit more structured, so there wouldn't be much trouble ingesting it.
Enter Scrapy
Scrapy is a handy Python framework for building web crawlers and parsing HTML content.
Now, Scrapy was probably overkill for what we needed since we were just parsing a couple of single page targets. As a framework, Scrapy is geared towards building spiders: bots that crawl webpages across links and build very robust pipelines of data. That said, it's a breeze to install and comes with enough syntactic bells and whistles that it was worth using, even if we only used about 1% what it is capable of.
mkvirtualenv elx_scrape
pip install scrapy
scrape startproject elx .
This starts a script project in the current directory called "elx".
I didn't end up doing much more with scrapy than is outlined in the tutorial section of their documentation, which is nicely detailed. I jumped in and created two crawlers, one for each data source:
#elx/spiders/base.py
class LocalSpider(scrapy.Spider):
name = 'local'
start_urls = [
'http://elections.wehco.com/elections/general2016/contested/vote/results',
]
def parse(self, response):
return []
class StateSpider(scrapy.Spider):
name = 'state'
start_urls = [
'http://www.politico.com/2016-election/results/map/ballot-measures/arkansas/',
]
def parse(self, response):
return []
These of course don't do anything but return an empty list, but each one pulls down the appropriate page and is ready for parsing.
The next step was to write the CSS/XPath selectors that would locate the data I sought. Possibly the coolest tool in the scrapy toolbox is its interactive shell that lets you quickly play around with a scraped page's data to design your parse methods:
After a lot of fiddling I ended up with parse functions for each crawler that looked something like this:
def parse(self, response):
for race in response.css('.elections-race'):
candidates = race.css('.candidate-tr')
try:
municipality = race.xpath('./preceding-sibling::h5/text()').extract()[-1]
except IndexError:
municipality = ""
yield {
'race_title': " ".join(race.css('.card-title::text').extract()),
'municipality': municipality,
'candidates': ["".join(c.css('.candidate-name > span::text').extract()).strip() for c in candidates],
'votes': [float("".join(c.css('.candidate-vote-count::text').extract()).strip().replace(',', '')) for c in candidates],
}
Which allowed me to run scrapy crawl local -o results.json and get something like this:
[
{
"municipality": "Dewitt",
"race_title": "ALDERMAN WARD 1, POSITION 1 ",
"candidates": [
"Ada Clark",
"Brent London"
],
"votes": [
460,
407
]
},
//...
]
Creating a Rube Goldberg Device
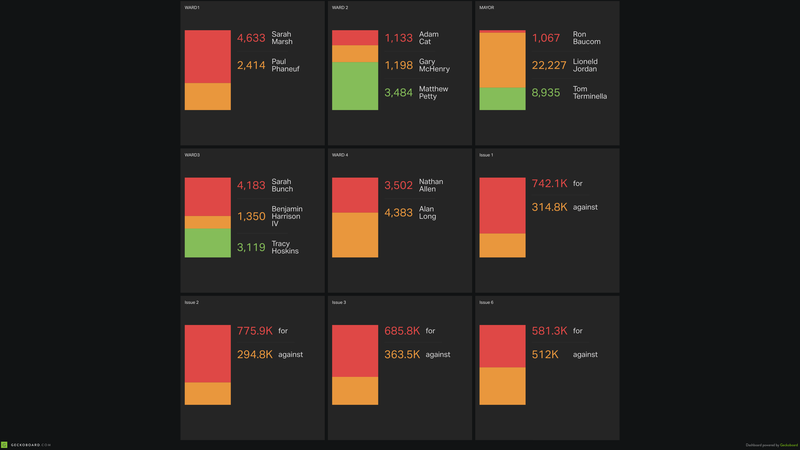
We decided on Geckoboard as the best option for quickly visualizing our data. It could pull sources over the web, we already had an account there, and it looks pretty decent.
We immediately found some problems in our data formatting though. The prebuilt widgets we thought would work best required:
- CSV data
- One CSV file per chart
That didn't quite fit what we had scraped, but we did what any programmer with minutes left on a deadline would do. We hacked and repeated a bunch of code!
Each Spider above was turned into a Pythonic base class with some sort of filtering in the parse method (only yield results if the race matches a certain title, etc) and created individual spiders for each race.
Luckily, switching scrapy's output to CSV was painless--it can be done through a project setting, or by simply specifying a .csv extension in your output file.
That machinery got wrapped by a shamefully barbaric shell script which refreshed our data every five minutes:
while true;
do
rm output/alderman1.csv
scrapy crawl alderman1 -o output/alderman1.csv
rm output/alderman2.csv
scrapy crawl alderman2 -o output/alderman2.csv
rm output/alderman3.csv
scrapy crawl alderman3 -o output/alderman3.csv
# ...
sleep 300;
done;
Now we had data being pulled to my laptop every 5 minutes--we just needed to get it web accessible for GeckoBoard to ingest it.
ngrok and SimpleHTTPServer
Ngrok is a neat tool that sets up a dynamic proxy to a local port. You receive a dynamic DNS name at *.ngrok.com which can make local device temporarily web accessible.
We ngrok all the time to demo local web applications to our team and clients before a product is in the cloud. Today though, I just needed to serve some static files to Geckoboard over HTTP.
Equally handy, Python ships with a lightweight (albeit not terribly efficient) web server module. We'll let Python serve the files and ask ngrok to proxy the local web server so Geckoboard can see it.
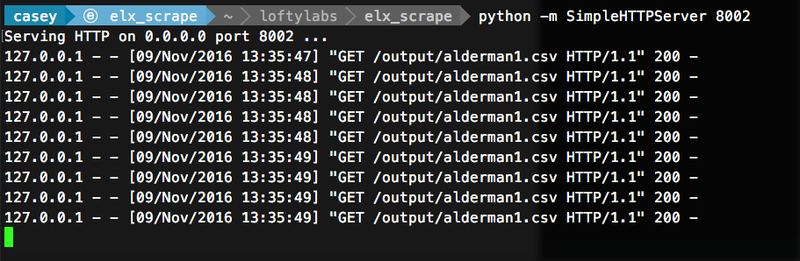
We turned on the Python webserver in our project's output dir:
cd output
python -m SimpleHTTPServer 8002
And instructed ngrok to proxy port 8002:
ngrok http 8002
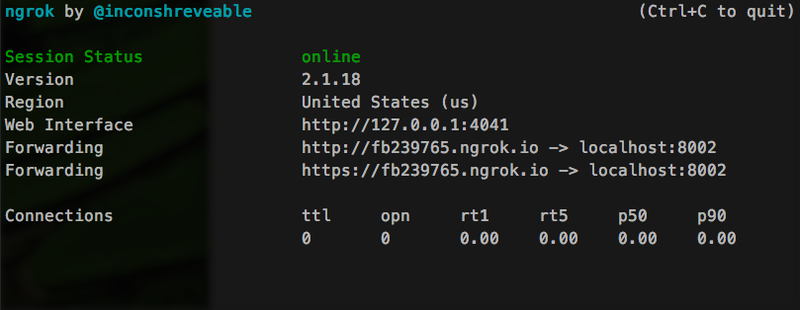
And that's everything we needed to serve the data up for Geckoboard. We were pretty happy with how it turned out and it was nice to get some fancy local results alongside the national coverage during our watch party (even if things didn't exactly go the way we had hoped, ahem).
Of course, there are many other ways to accomplish the same thing--some far more robust and stable. Perhaps closer to real time if you have access to the correct data sources.
In all, though, we were pretty happy with what could be accomplished in just a couple of hours of relatively low effort.
#MayorJordan4Lyfe

.jpg)

