We like personal projects here at Lofty Labs.
As developer consultants, it's a good way to clear our heads when we get stuck on a tough problem on client projects. It also provides an opportunity to experiment with a new technology or platform. After all, not every client wants to be our guinea pig. But, if we allow ourselves to spend a few hours here and there, we can add something new to our capabilities.
Just a couple of weeks ago our Director of Engineering, Addam Hardy, released parappa on our Github page. Parappa is our house DJ who lives in our Slack team and allows us to control our Sonos speaker system in the office.
I was inspired to open source something as well, so I spent a day or two on the initial build of Django Developer Panel.
Django Developer Panel
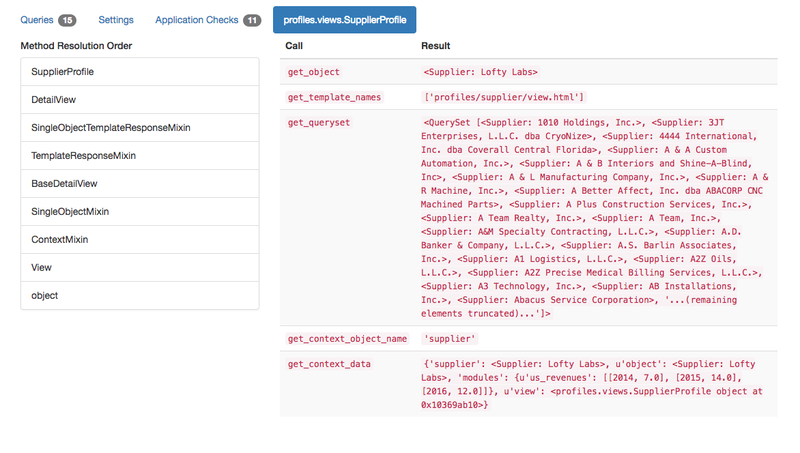
Django Developer Panel is a Google Chrome extension paired with a piece of Django middleware that highlights helpful data to assist in the debugging and construction of Django applications. It was inspired heavily by, and some portions of the middleware code derived from, the very popular Django Debug Toolbarplugin, as well as the Ember Inspector plugin.

Django Developer Panel differs from Django Debug Toolbar in a few ways:
- The UI is handled entirely by Chrome's Developer Tools
- Configuration on the Django side is as minimal as possible
- It features a minimal set of panels with more emphasis on application state
Installation
Pick up the Chrome extension from the Chrome Web Store, then follow the instructions for configuring your Django application on the Django package GitHub readme.
It's currently tested against Django 1.10+, Python 2.7.12 and Python 3.6.
Rationale
The biggest motivator for creating Django Developer Panel, if I'm honest with myself, was because I wanted to experiment with building a Chrome extension. Many developers happily use Django Debug Toolbar every day (it has over 4000 stars on GitHub and nearly 160 individual contributors), and I say more power to them.
Personally, I find the Debug Toolbar to contain redundant information that I already use the Chrome Developer tools for (request/response headers, inspecting redirects), so I wanted the option to have a more minimal set of tools directly in my developer tools drawer.

After getting started with it, I was inspired by the Ember Inspector extension to dive deeper into the state of Django's views. When using Class Based Views, the predictable API opens a lot of doors into exposing the internal state of a View after its execution, and this has turned into the major differentiating feature from Django Debug Toolbar.
Roadmap
Housekeeping and cleanup needs:
- Test coverage, because there's none right now
- Completely decouple UI from backend. Adding new items to the interface currently requires an update to the chrome extension.
- CI w/ Tox - Run tests against multiple versions of Django/Python to ensure compatibility with the largest portion of projects as possible.
Features I'd like to add in the near term include:
- Template context introspection
- Template hierarchy explorer (a la Django Debug Toolbar)
- In-page alerts
In-page alerts in particular showcase some of the advanced features that can be leveraged by Chrome's dev tools over simply injecting a sidebar into the page. Communicating through Chrome's background pages, Django Developer Panel would be able to inject on-page alerts even when developers are not actively inspecting Django's state.
One particularly useful alert might be a query count threshold notification that informs developers when an application is querying the ORM in a loop or missing a join.


.jpg)

